The Yield Curve page in Fairways Debt enables you to quickly identify the market rates for your transactions at fixed and variable rates.
Log In to Fairways Debt
- Log in to Fairways Debt.
- Load the relevant customer account.
Navigate to Yield Curve
- Click Financial Markets.
- Click Yield Curve.
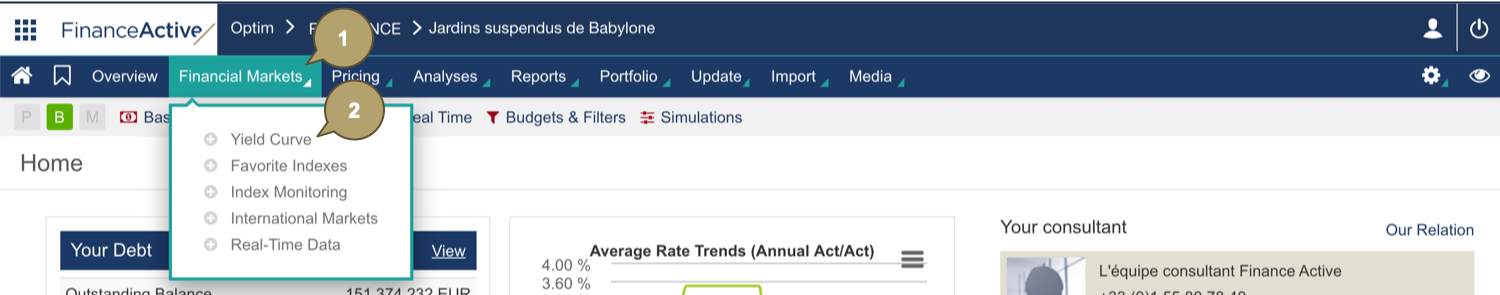
The Yield Curve page displays.
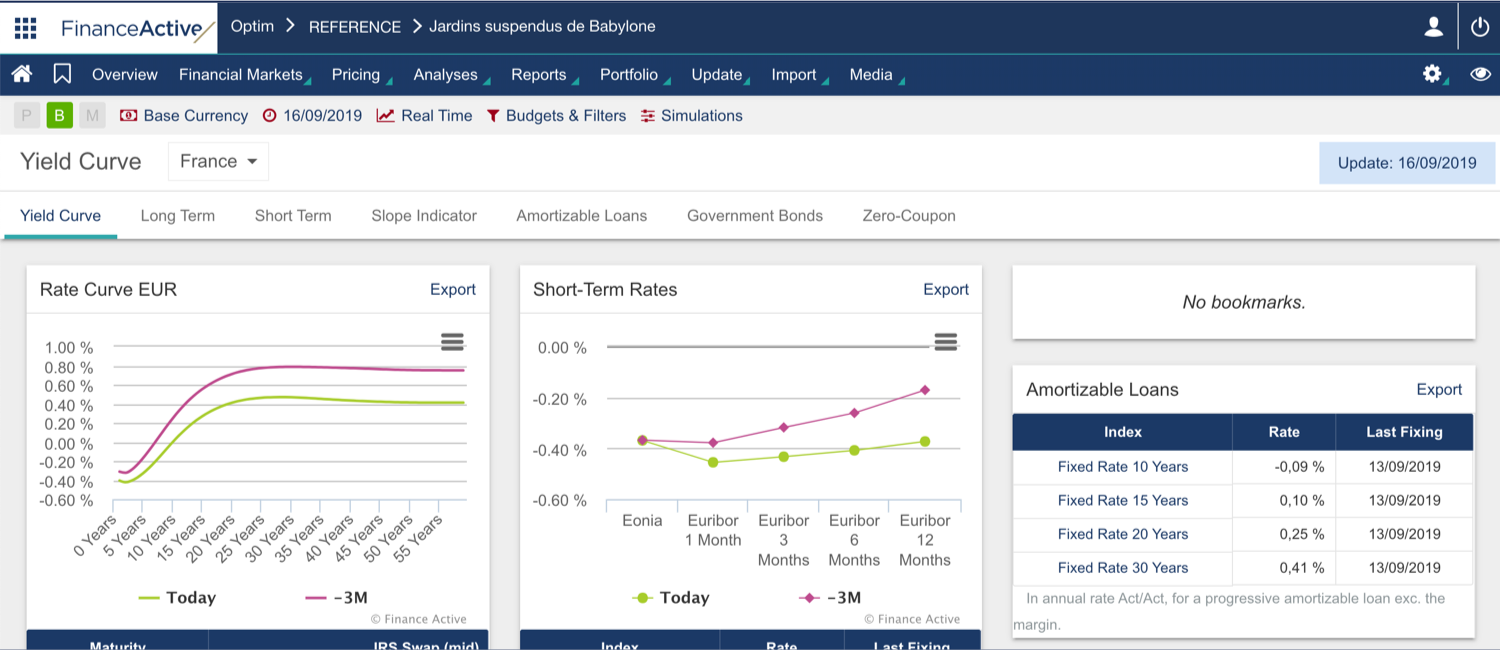
When you borrow at a fixed rate, this fixed rate is calculated based on long-term market rates, i.e. those with a maturity higher than a year.
One of the main references for fixed-rate loans is the swap rate (Interest Rate Swap or IRS). Financial institutions apply that rate on different maturities for a bullet loan. The swap rates are available in the table located on the left, under the Rate Curve graph.
The Rate Curve graph presents the swap rates of today (in green) and those of 3 months ago (in pink), so you can define the period trend.
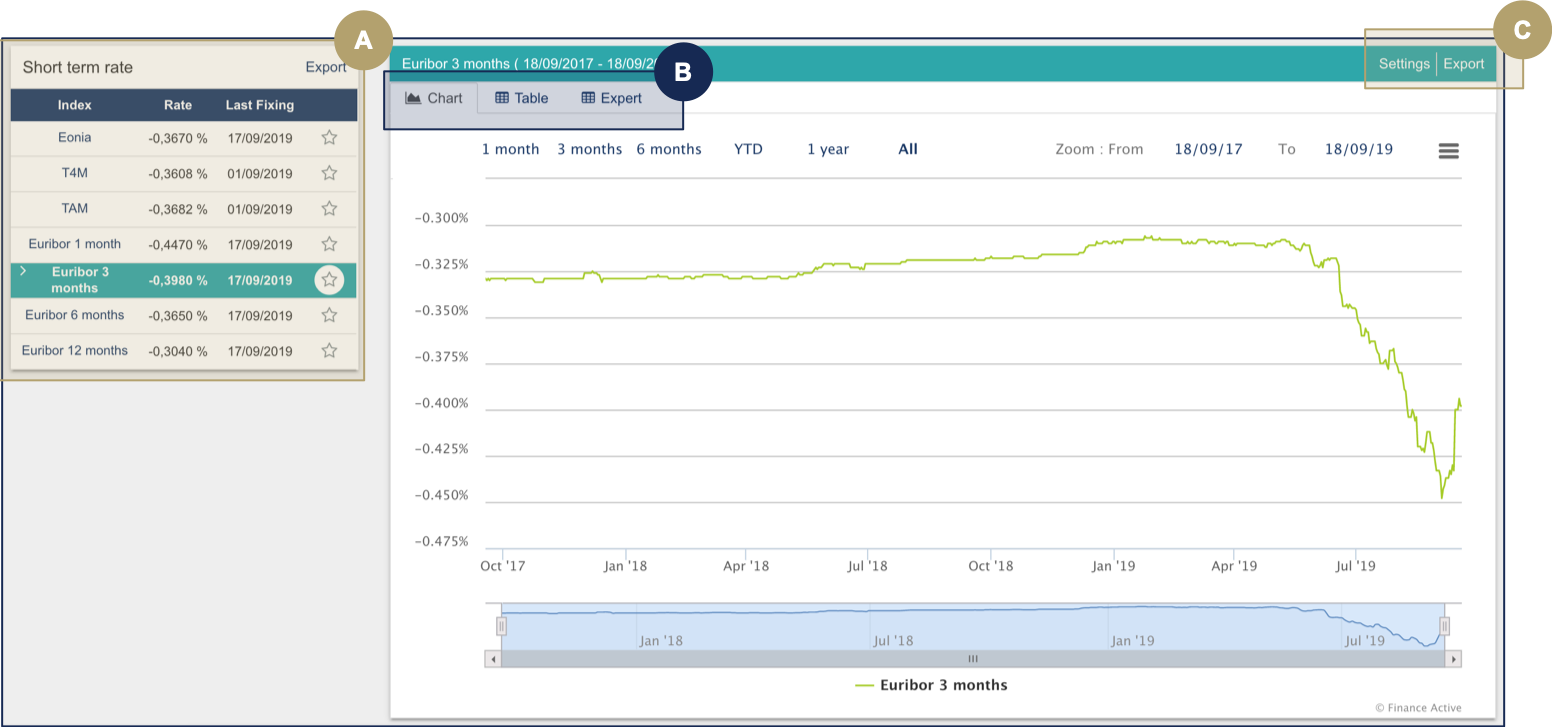
The maturity of short-term rates does not exceed 12 months. When you borrow at a floating rate, you actually use these rates.
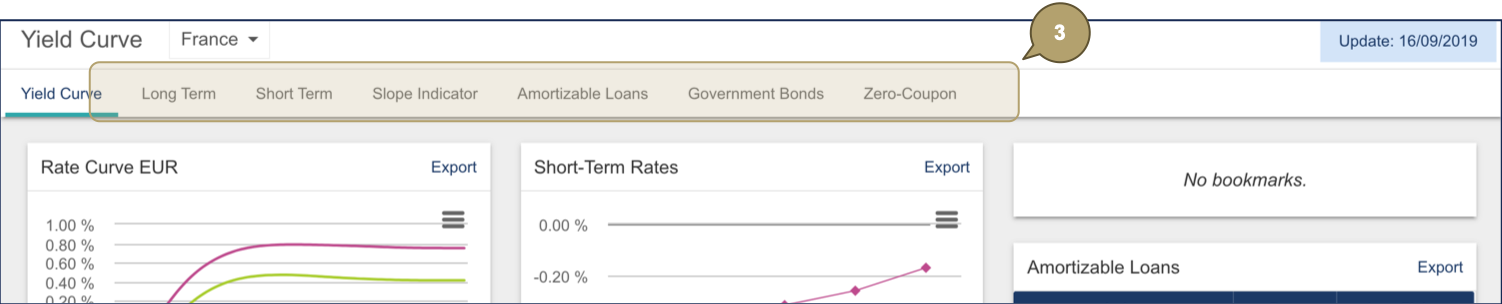
- Click a tab to open relevant data.
|
# |
Description |
|---|---|
|
A |
Latest rates of indexes. |
|
B |
Different views of data:
|
|
C |
Actions:
|