The Overview section in Fairways Debt is composed of 3 tabs, introducing concise information related to your debt: average rate, remaining term, average term to maturity, debt by risk type, etc.
Log In to Fairways Debt
- Log in to Fairways Debt.
- Load the relevant customer account.
Open the Dashboard of the Overview
Navigate to Overview > Dashboard.
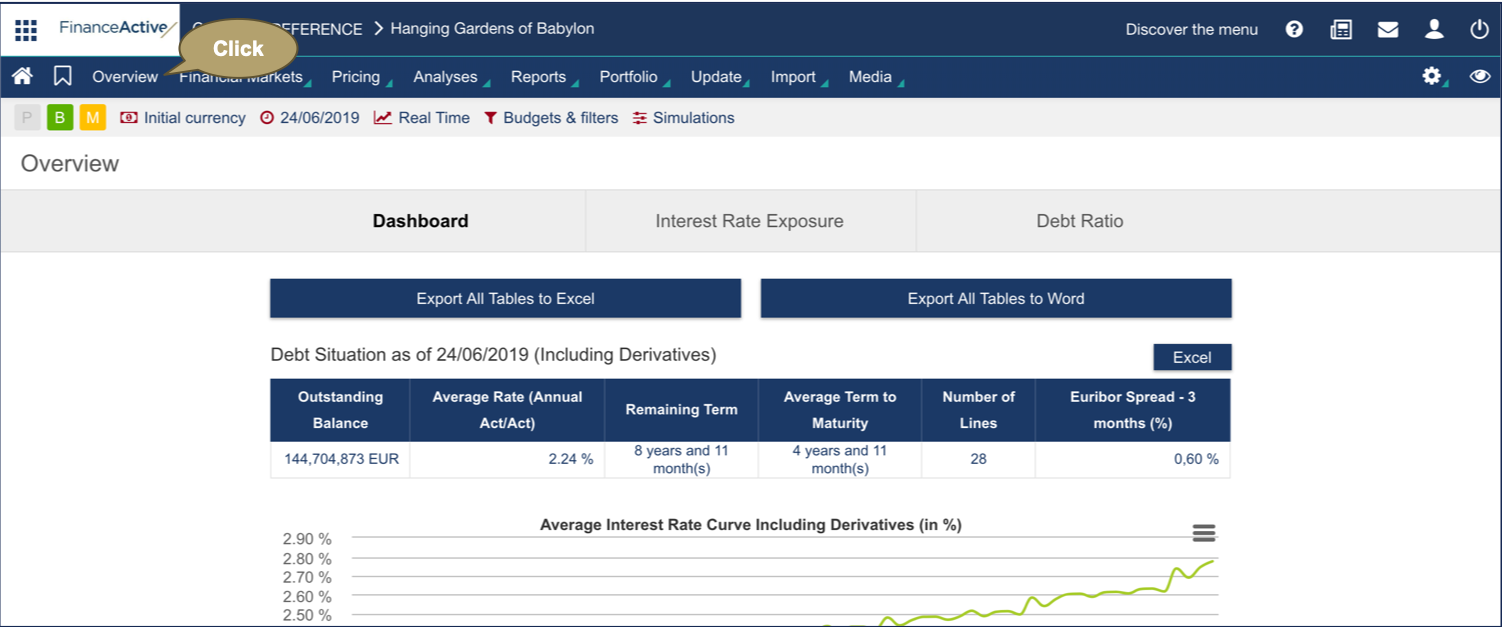
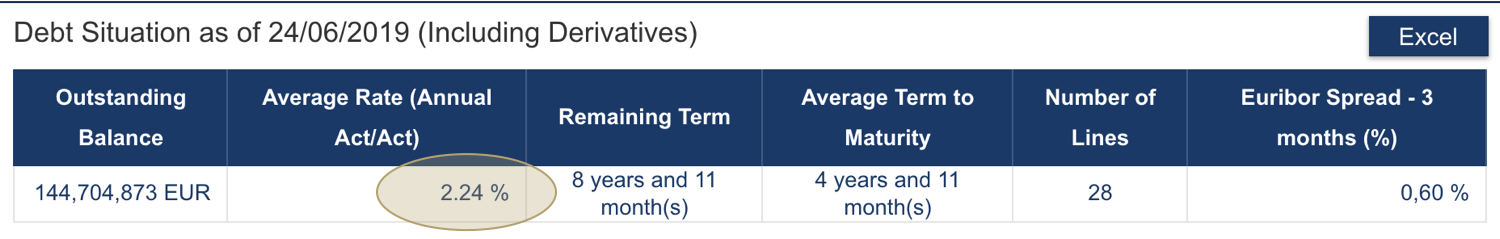
The Debt Situation includes the average rate of your borrowing portfolio, e.g. 2,24%.
The Average Interest Rate Curve Including Derivatives shows how the average rate evolves over the next 5 years.

The debt types of your balance distinguish standard loans from loans with revolving credit.
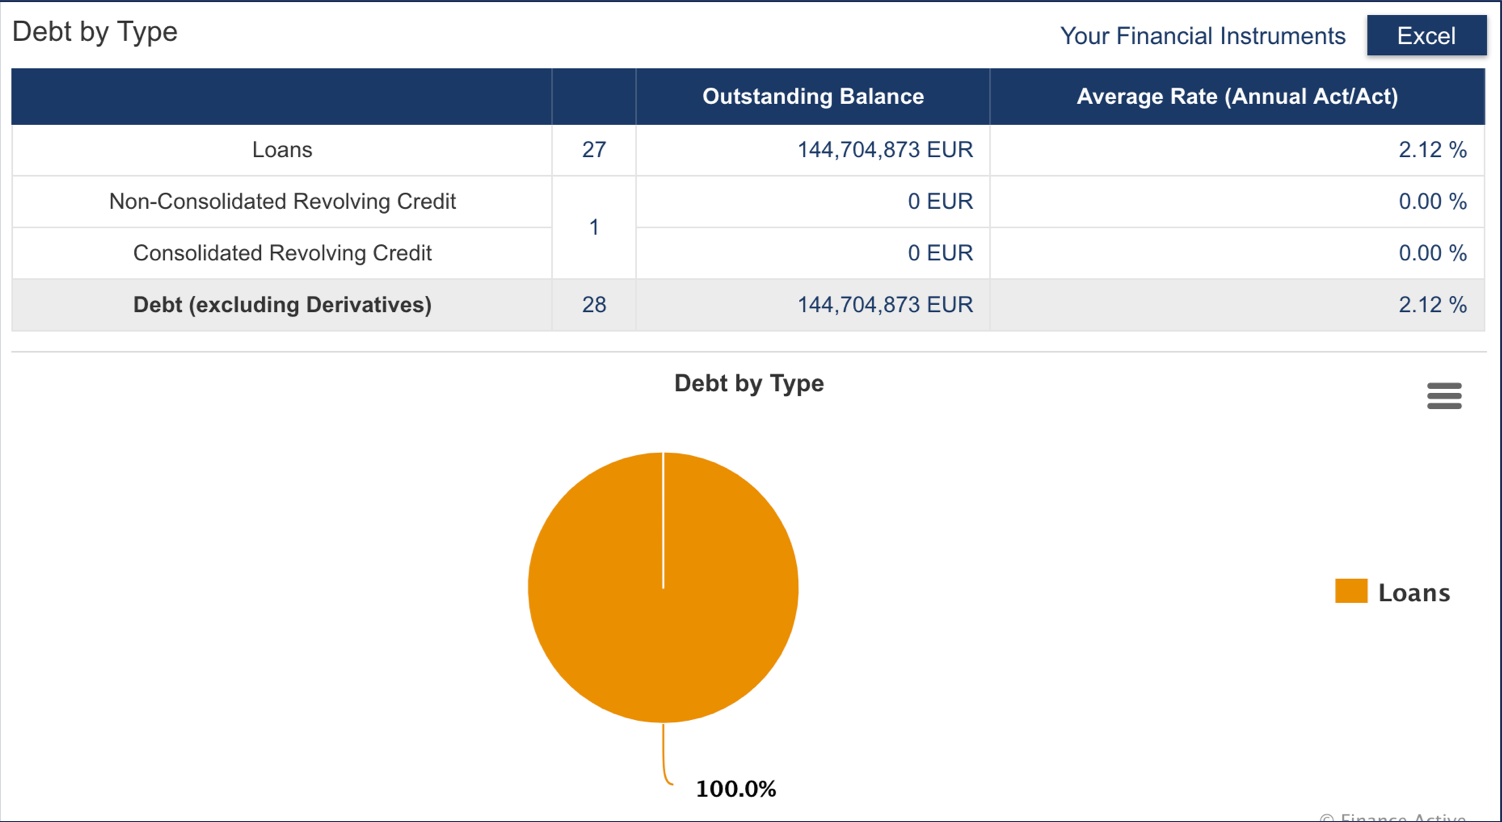
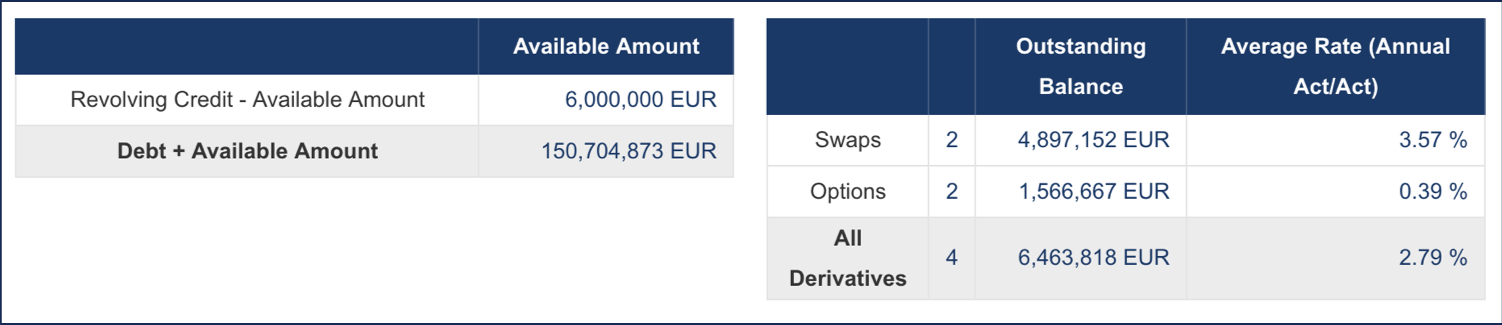
The available amount, i.e. not yet drawn from your revolving loans, and notional amounts of swaps and options are presented.
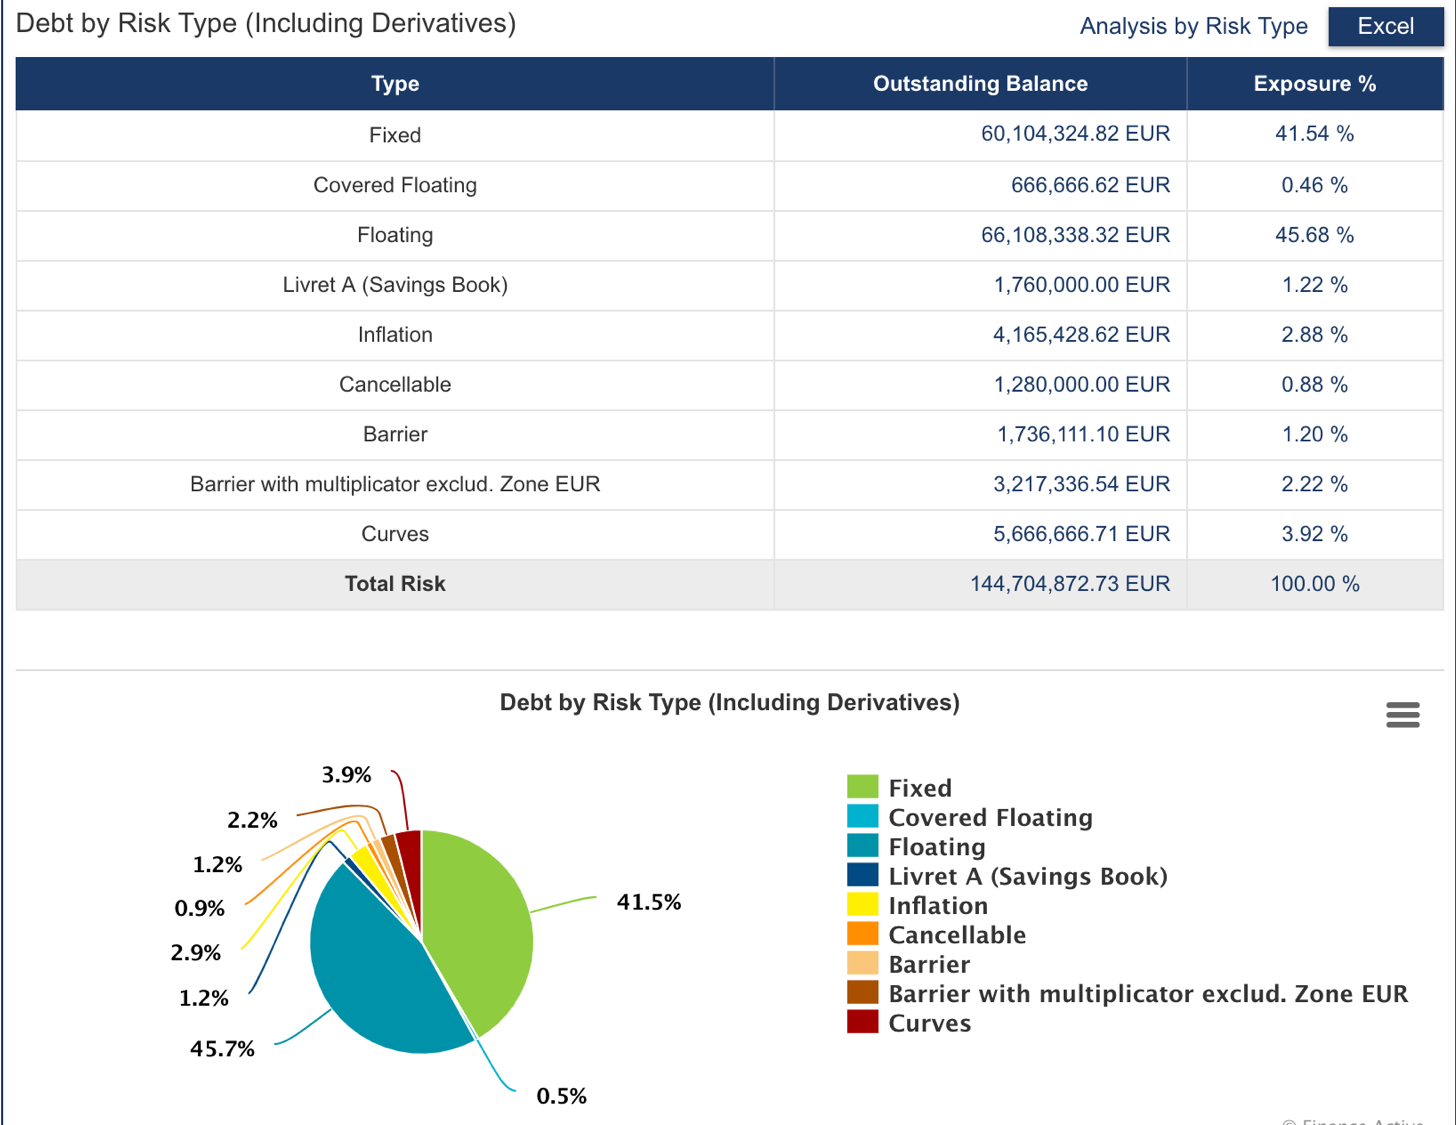
Debt is also shown by risk type as of today, as well as the average rate of each indexation available in your balance.
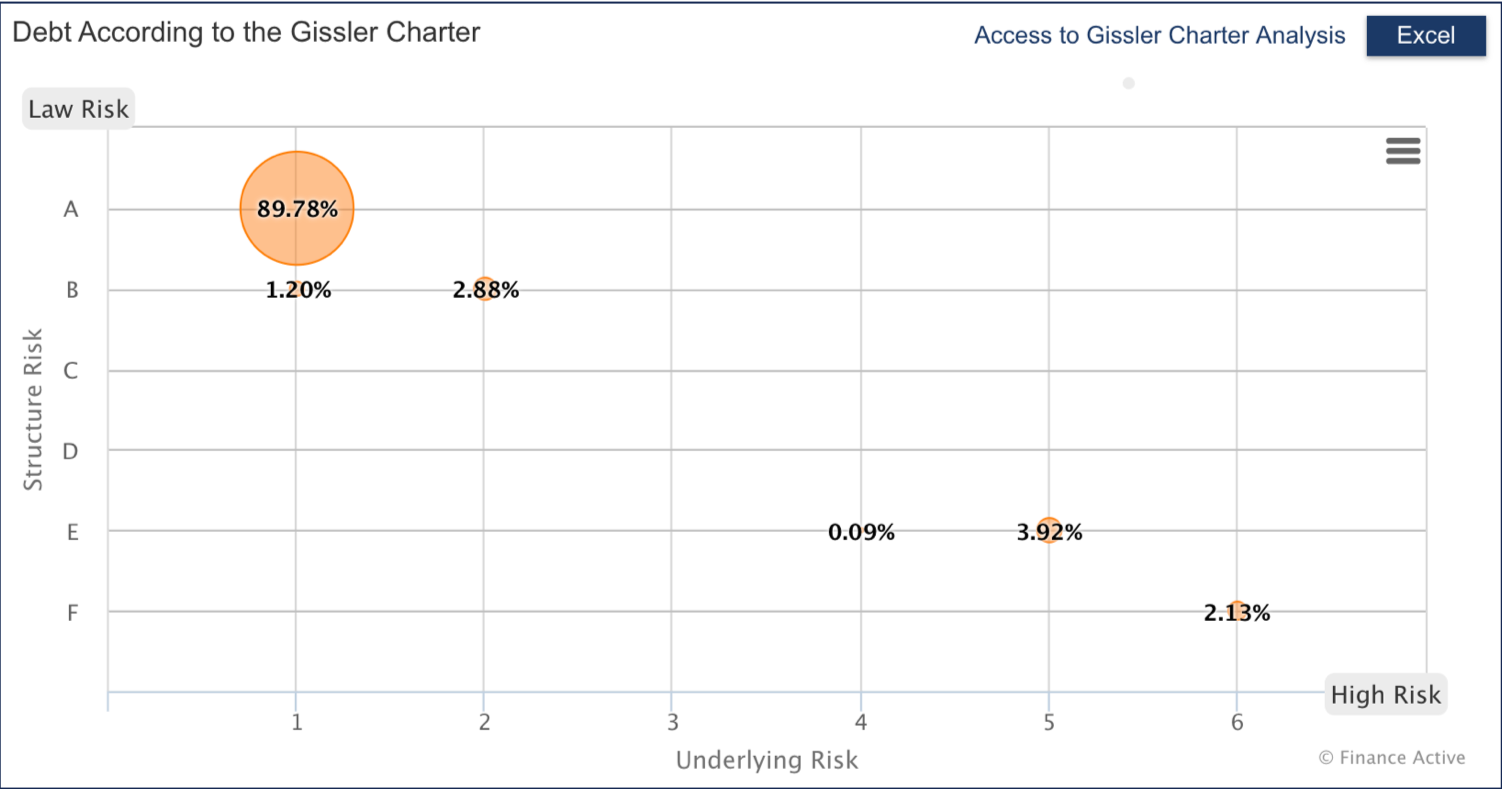
A chart presents the distribution of your balance according to the Gissler charter, as of today. Loans at fixed and floating rates are marked as 1A and are located on the top-left of the chart. Riskier loans are located on the bottom right.
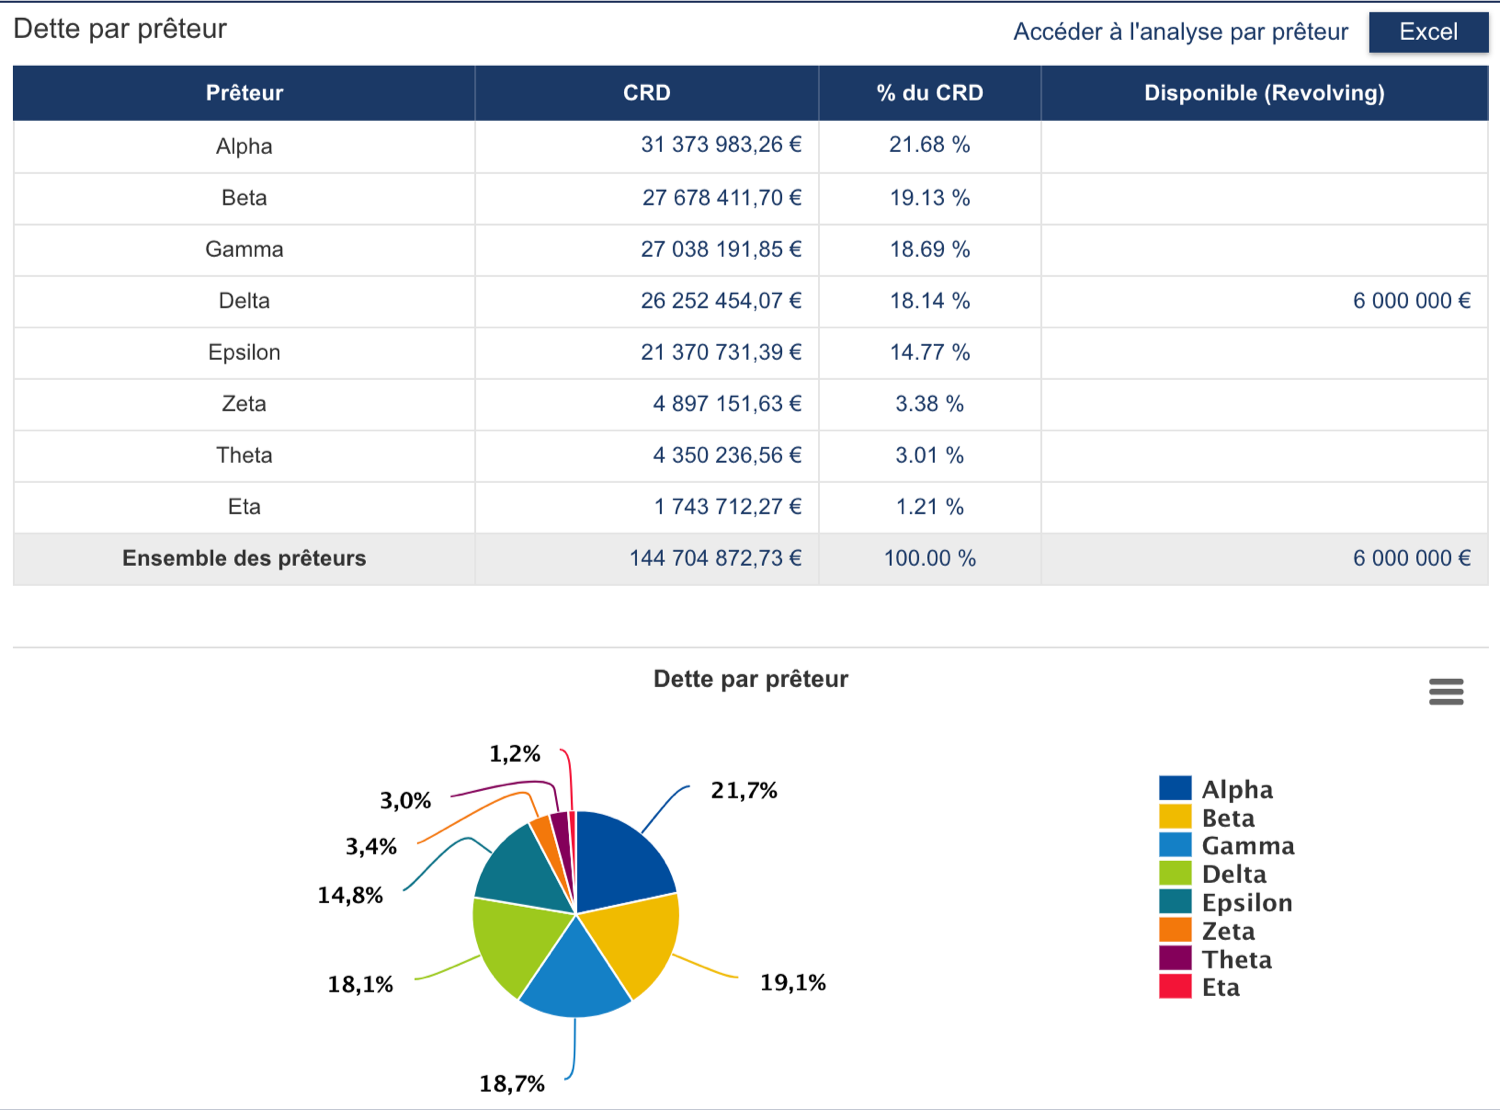
A table and a chart illustrate the distribution of your balance by lender unit, as well as its outstanding balance.
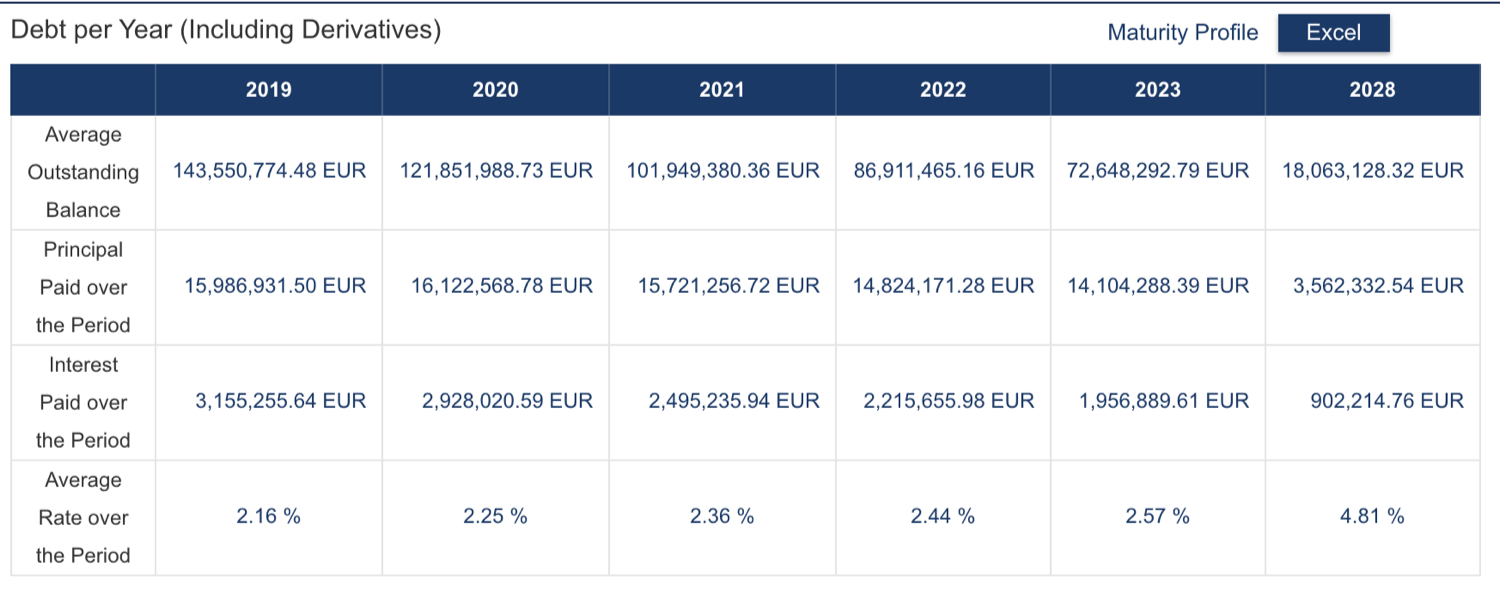
The table of average rates over the next 5 years and in 10 years include, among others:
- The average outstanding balance, i.e. the average of balances daily observed in Fairways Debt during the year.
- The average rate over the period, different from the average rate of the Average Interest Rate Curve Including Derivatives chart. Here, it is the relationship between the financial fees over the period and the average balance.